While dashboards are familiar business tools, the Getting to Zero IL (GTZ-IL) HIV Dashboard brings innovation to the search for HIV data. This interactive tool allows researchers, community-based organizations (CBOs), and anyone else interested in HIV to drill down and visualize HIV data trends and patterns in Illinois.
Gregory Phillips II, Ph.D., assistant professor of medical social sciences and preventive medicine at Northwestern University, Feinberg School of Medicine, co-leads development of the dashboard with colleague Nanette Benbow, research assistant professor of psychiatry and behavioral sciences. The dashboard was built in partnership with the AIDS Foundation Chicago (AFC), Chicago Department of Public Health, and Illinois Department of Public Health.
Dashboard’s crosstabs find data intersections, measure impact of programs
Using crosstabs to explore data at the intersection of several demographic groups (age, race, gender) is a distinctive feature of the dashboard.
Crosstabs reveal relationships in data that are not immediately apparent. For example, a report may include two different data points: the number of new HIV cases among people aged 20 to 29 and the number among Black people. With crosstab functionality, the dashboard pinpoints how many Black people aged 20 to 29 live with HIV in Illinois. Rather than viewing a static report, users can select among the multiple demographic groups to create graphs focused on the populations they serve.
“The ability to focus on specific populations through crosstabs is a valuable resource for HIV organizations,” Benbow said. “It allows them to measure the impact of their programs on the specific populations they serve and enables them to make the case for funding to initiate new services or continue existing operations.”
The #gtzIL2030 dashboard is LIVE! This tool, built in partnership with @ChiPublicHealth, @IDPH, and @NorthwesternU, allows us to measure the state’s progress to get to zero new HIV cases in Illinois by 2030.
Explore the data today: https://t.co/Y8rRRxbTcA pic.twitter.com/qoYhGpM08z
— AIDS Foundation Chicago (@AIDSChicago) August 18, 2021
Community-driven dashboard maps to GTZ-IL Plan
The community-driven dashboard maps closely to the goals and priorities of the GTZ-IL Plan and measures the state’s progress towards getting to zero new HIV cases in Illinois by 2030, Phillips explained. For example, retaining people in HIV care and getting them virally suppressed is a challenge. “The dashboard is helpful in highlighting that situation and showing people where the work needs to be done,” he said. HIV community members from AFC to CBOs throughout the state shared information for dashboard reports.
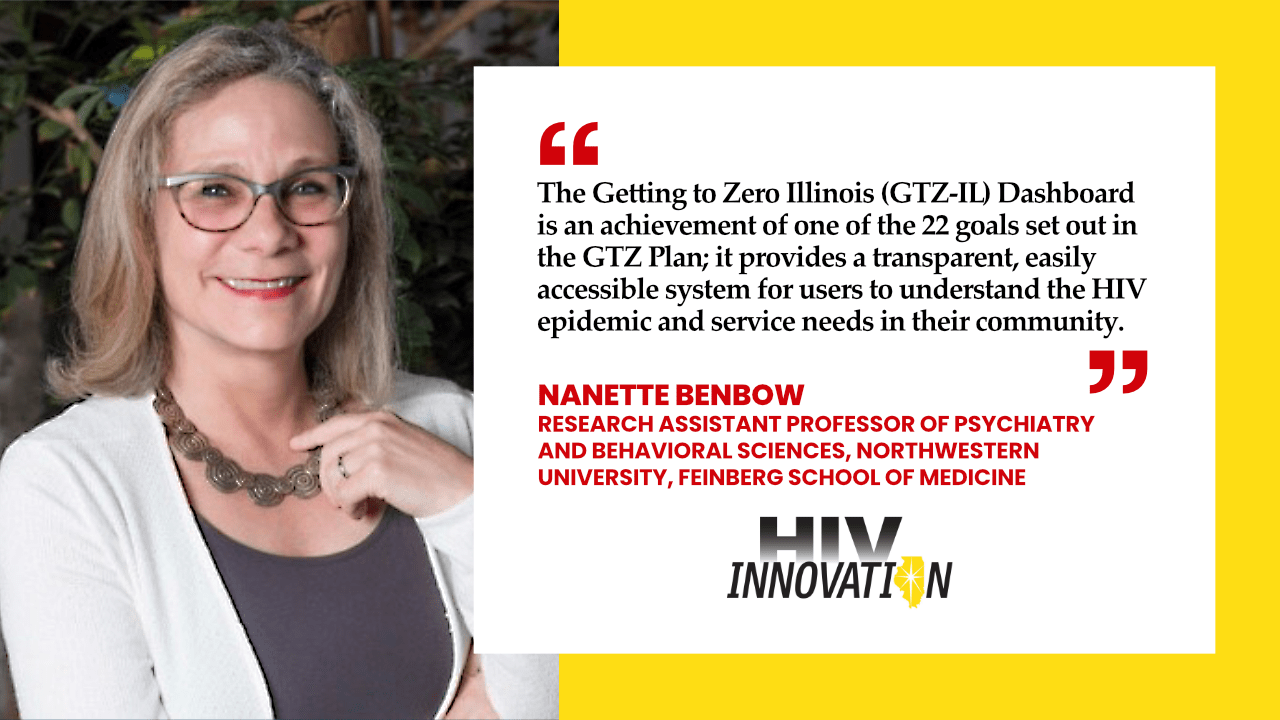
Benbow added that the dashboard is an achievement of one of the 22 goals set out in the GTZ Plan; it provides a transparent, easily accessible system for users to understand the HIV epidemic and service needs in their community.
Bringing data to anyone interested in knowing more about HIV
Researchers, heads of health departments, or others with technical knowledge benefit from the many components of this interactive data repository. In addition, anyone living with HIV or who wants to know more about HIV can use the dashboard to better understand what’s happening with HIV in Chicago or other Illinois communities.
Focusing on the user experience
The dashboard’s development team spent time testing how people navigated, interacted with, and posed questions on components of the website rather than simply publishing data. Phillips noted that the dashboard matches the AFC’s GTZ color scheme, perhaps a minor distinction but one that improves the experience for the people using the dashboard.
Looking ahead
Updates to the dashboard with the most recent data will happen at least annually, depending on available data sources. This step will ensure the dashboard remains a living document that reflects innovations in HIV, Phillips said. For example, injectable PrEP wasn’t accessible when the team developed the GTZ-IL Plan, which means they have to figure out how to work it into the next version.
“We’re happy that we were able to do this for the entire state because so much is focused on Chicago,” Phillips stated. “While we still face some data gaps, we have a full city and state picture with comparable data, and that’s unique.”
Find out more about the dashboard and how to use it at Getting To Zero-IL HIV Dashboard.


